对python mayavi三维绘图的实现详解
网上下载mayavi的官方帮助文档,里面有很多例子,下面的记录都是查看手册后得到的。
http://code.enthought.com/projects/mayavi/docs/development/latex/mayavi/mayavi_user_guide.pdf
python的mayavi.mlab库中的绘图函数有很多候选参数,但下文记录并没有过多讨论,本人也是需要用到才查看手册的。
安装好mayavi2的绘图环境后,可以结合numpy进行科学绘图,在代码中事先加入如下代码:
  import mayavi.mlab as mlab
  from numpy import exp,sin,cos,tan,random,mgrid,ogrid,linspace,sqrt,pi
  import numpy as np
  import matplotlib.pyplot as plt
  mlab.figure(fgcolor=(0, 0, 0), bgcolor=(1, 1, 1)) #更改背景色
  #添加matlab的peaks函数
  def peaks(x,y):
    return 3.0*(1.0-x)**2*exp(-(x**2) - (y+1.0)**2) - 10*(x/5.0 - x**3 - y**5) * exp(-x**2-y**2) - 1.0/3.0*exp(-(x+1.0)**2 - y**2)
首先从帮助手册上了解下mayavi的colormap,如下图:
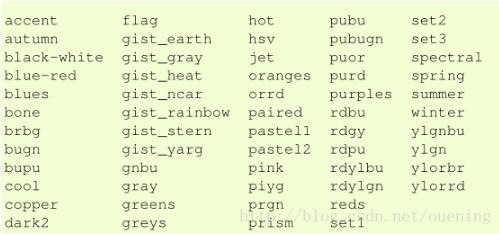
下面列举常用的三维绘图函数和简单例子。
一、barchart
* barchart(s, ...)
* barchart(x, y, s, ...)
* barchart(x, y, f, ...)
* barchart(x, y, z, s, ...)
* barchart(x, y, z, f, ...)
如果只传递一个参数,可以是一维(1-D),二维(2-D)或3维(3-D)的给定向量长度的数组;
如果传递三个参数(x,y,s)或(x,y,f),x,y是对应于数组s的二维(2-D)坐标,也可以是可调用的函数f,该函数返回数组;
四个参数的时候(x,y,z)表示三维坐标
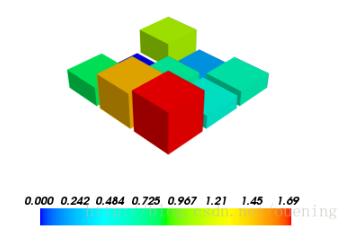
  s = np.random.rand(3,3)
  mlab.barchart(s)
  mlab.vectorbar()
  mlab.show()
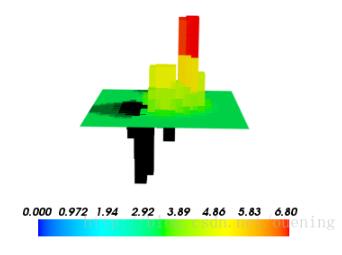
 x,y = np.mgrid[-5:5:20j,-5:5:20j]
  s = peaks(x,y)   #peaks函数前面已经定义
  mlab.barchart(x,y,s)
  mlab.vectorbar()
  mlab.show()
二、contour3d
* contour3d(scalars, ...)
* contour3d(x, y, z, scalars, ...)
* contour3d(x, y, z, f, ...)
scalars是三维数组(3-D),x,y,z用numpy.mgrid生成,是三维数组
  x, y, z = ogrid[-5:5:64j, -5:5:64j, -5:5:64j]
  scalars = x * x * 0.5 + y * y + z * z * 2.0
  mlab.contour3d(scalars, contours=6, transparent=True)
  mlab.colorbar()
  mlab.show()

三、contour_surf
* contour_surf(s, ...)
* contour_surf(x, y, s, ...)
* contour_surf(x, y, f, ...)
s是二维数组,f是可调用的函数,例如peaks函数
x and y can be 1D or 2D arrays (such as returned by numpy.ogrid or numpy.mgrid)
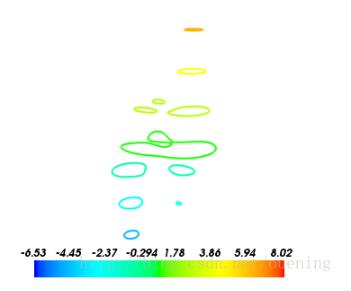
  x,y = np.mgrid[-5:5:70j,-5:5:70j]
  #绘制peaks函数的等高线
  mlab.contour_surf(x,y,peaks,contours=9)
  mlab.colorbar()
  mlab.show()
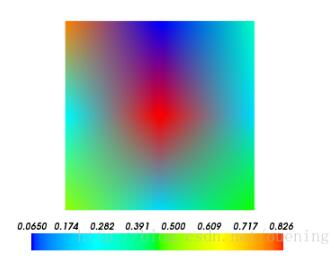
四、imshow
* imshow(s, ...)
s is a 2 dimension array. The values of s are mapped to a color using the colormap.

  s = np.random.rand(3,3) #生成随机的3×3数组
  mlab.imshow(s)
  mlab.colorbar()
  mlab.show()
五、mesh
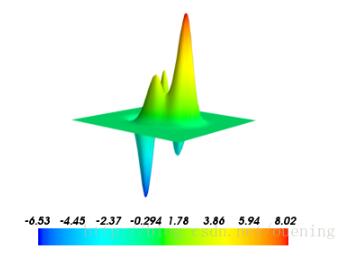
* mesh(x, y, z, ...)
x, y, z are 2D arrays, all of the same shape, giving the positions of the vertices of the surface.
x , y , z 都是二维数组,拥有相同的shape,而且z代表了平面坐标(x,y)对应下的值,下面绘制的是matlab的peaks函数三维图,可能是因为绘图比例的原因看起来并没有matlab下绘制的好看
  y,x = np.mgrid[-5:5:70j,-5:5:70j]
  z=peaks(x,y)
  mlab.mesh(x,y,z)
  mlab.colorbar()
  mlab.show()
六、surf
* surf(s, ...)
* surf(x, y, s, ...)
* surf(x, y, f, ...)
x , y可以是1-D或者2-D的数组(比如numpy.ogrid或numpy.mgrid返回的数组)
如果只传递了参数数组s,那么x,y就被认为是数组s的索引值,并且创建等宽的数据集。(If only 1 array s is passed, the x and y arrays are assumed to be made from the indices of arrays, and an uniformly-spaced data set is created.)
surf和mesh的不同之处在于surf的参数x,y可以是一维(1-D)的。
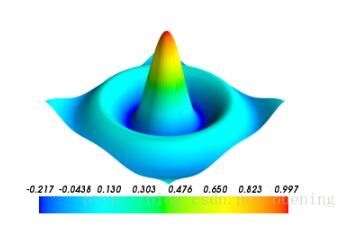
  mlab.clf()
  x, y = mgrid[-10:10:100j, -10:10:100j]
  r = sqrt(x**2 + y**2)
  z = sin(r)/r
  # mlab.surf(x,y,z,wrap_scale='auto')
  mlab.surf(z, warp_scale='auto')
  mlab.colorbar()
  mlab.show()
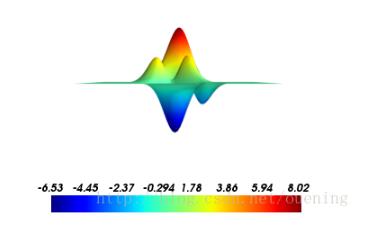
surf函数同样可以绘制peaks曲面,
  pk_y,pk_x = np.mgrid[-5:5:70j,-5:5:70j]
  pk_z=peaks(pk_x,pk_y)
  mlab.surf(pk_z,warp_scale='auto',colormap='jet')
  mlab.colorbar()
  mlab.show()
这里只传递了一个参数pk_z,
七、plot3d
* plot3d(x, y, z, ...)
* plot3d(x, y, z, s, ...)
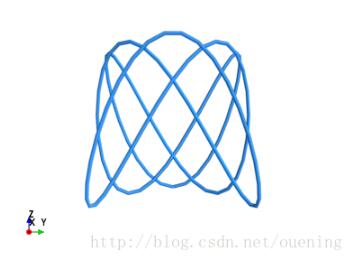
数据点之间绘制线段,x,y,z,s都是具有相同shape的numpy数组或列表(list),x,y,z是三维坐标,也就是空间中数据点的位置
  t=mgrid[-pi:pi:100j]
  mlab.plot3d(cos(t),sin(3*t),cos(5*t),color=(0.23,0.6,1),colormap='Spectral')
  mlab.colorbar()
  mlab.show()
八、points3d
* points3d(x, y, z...)
* points3d(x, y, z, s, ...)
* points3d(x, y, z, f, ...)
和前面的plot3d差不多,只不过points3d只绘制三维坐标下的点(x,y,z),仍然用前面的例子。
  t=mgrid[-pi:pi:50j]
  s=sin(t)
  # 参数s是设置每个点的大小(scalar),mode可选
  mlab.points3d(cos(t),sin(3*t),cos(5*t),s,mode='sphere',line_width=1)
  mlab.colorbar()
  mlab.show()

参数的mode可选项如下图:

九、quiver3d
* quiver3d(u, v, w, ...)
* quiver3d(x, y, z, u, v, w, ...)
* quiver3d(x, y, z, f, ...)
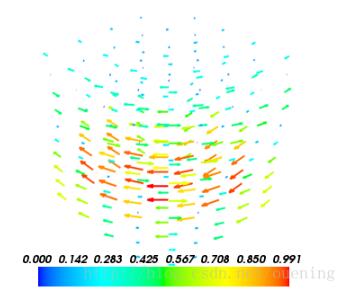
  x,y,z=mgrid[-0:3:0.6,-0:3:0.6,0:3:0.3]
  r=sqrt(x**2+y**2+z**4)
  u=y*sin(r)/(r+0.001)
  v=-x*sin(r)/(r+0.001)
  w=zeros_like(r)
  mlab.quiver3d(x,y,z,u,v,w)
  mlab.colorbar()
  mlab.show()
十、animate
绘制三维动图,帮助文档上的代码执行后并没有动画效果,下面2个示例代码是查看了mayavi的相关源码后总结的,大家也可以直接查看相关源码查看更多官方提供的示例代码。
(1)
  @animate(delay=200) # 设置延时时间200ms
  def anim():
    n_mer, n_long = 6, 11
    pi = numpy.pi
    dphi = pi/1000.0
    phi = numpy.arange(0.0, 2 * pi + 0.5 * dphi, dphi, 'd')
    mu = phi * n_mer
    x = numpy.cos(mu) * (1+numpy.cos(n_long * mu/n_mer) * 0.5)
    y = numpy.sin(mu) * (1+numpy.cos(n_long * mu/n_mer) * 0.5)
    z = numpy.sin(n_long * mu/n_mer) * 0.5
    l = plot3d(x, y, z, numpy.sin(mu), tube_radius=0.025, colormap='Spectral')
    ms = l.mlab_source
    for i in range(100):
      x = numpy.cos(mu) * (1+numpy.cos(n_long * mu/n_mer + numpy.pi * (i+1)/5.) * 0.5)
      scalars = numpy.sin(mu + numpy.pi * (i+1)/5)
      #不改变shape和size的情况下用set来更改属性值
        ms.set(x=x, scalars=scalars)
      yield
  anim()
  show()
(2)
  @animate #默认500ms延时
  def anim2():
    x, y = np.mgrid[0:3:1,0:3:1]
    s = mlab.surf(x, y, np.asarray(x*0.1, 'd'),representation='wireframe')
    fig = mlab.gcf()
    ms = s.mlab_source
    for i in range(15):
      x, y = np.mgrid[0:3:1.0/(i+2),0:3:1.0/(i+2)]
      sc = np.asarray(x*x*0.05*(i+1), 'd')
      ms.reset(x=x, y=y, scalars=sc)
      fig.scene.reset_zoom()
      yield
  anim2()
  show()
以上这篇对python mayavi三维绘图的实现详解就是小编分享给大家的全部内容了,希望能给大家一个参考,也希望大家多多支持脚本之家。


最新评论