python绘制饼图的方法详解
更新时间:2022年03月17日 17:10:21 作者:Vergil_Zsh
这篇文章主要为大家详细介绍了python绘制饼图的方法,文中示例代码介绍的非常详细,具有一定的参考价值,感兴趣的小伙伴们可以参考一下,希望能够给你带来帮助
用法
matplotlib.pyplot.pie(x, explode=None, labels=None, colors=None, autopct=None, pctdistance=0.6, shadow=False, labeldistance=1.1, startangle=0, radius=1, counterclock=True, wedgeprops=None, textprops=None, center=(0, 0), frame=False, rotatelabels=False, *, normalize=True, data=None)
参数介绍
| 参数 | |
|---|---|
| x | 楔形尺寸 |
| explode | 类似数组,默认值: 无,如果不是无,则是一个len(x)数组,用于指定偏移每个楔块的半径 |
| labels | 标签列表:默认值:无,为每个楔块提供标签的一系列字符串 |
| colors | 颜色,默认值:无,饼图循环使用的一系列颜色,如果没有,将使用当前活动周期中的颜色 |
| autopct | 默认值:无,如果不是无,则是一个字符串或函数,用于用数字值标记楔块.标签将放在楔子内,如果是格式字符串,则标签为fmt%pct,如果是函数,则调用 |
| pctdistance | 默认值为0.6,每个饼图切片的中心与生成的文本开头之间的比率 |
| shadow | 默认值为:False,楔块的阴影 |
| labeldistance | 默认值1.1,绘制饼图标签径向距离,如果设置为’无’,则不会绘制标签,会存储标签以供在图列()中使用 |
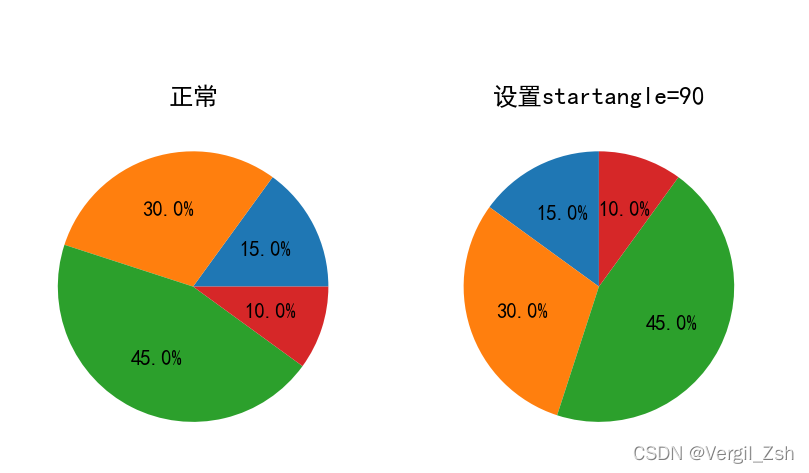
| startangle | 饼图角度起始角度 |
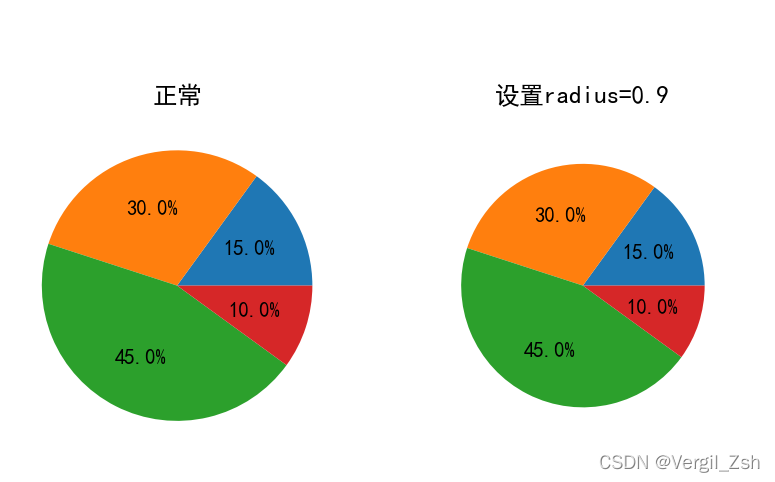
| radius | 默认值1,饼图的半径,数值越大,饼图越大 |
| counterclock | 设置饼图的方向,默认值为True,表示逆时针方向,False,为顺时针 |
| wedgeprops | 默认值:无,传递给楔形对象的参数,设置楔形的属性 |
| textprops | 设置文本对象的字典参数 |
| center | 浮点类型的列表,可选参数,图标中心位置 |
| frame | 是否选择轴框架,默认值为False,如果是True,则绘制带有表的轴框架 |
| rotatelabels | 默认值为False,布尔类型,如果为True,则将每个标签旋转到相应切片的角度 |
| narmalize | 布尔类型,默认值为True,如果为True,则始终通过规范化x来制作完整的饼图,使总和(x)=1。如果sum(x)<=1,False将生成部分饼图,并为sum(x)>1引发ValueError。 |
| data | 可选参数,如果给定,一下参数接受字符串s,该字符串被解释为数据[s] |
案例
x
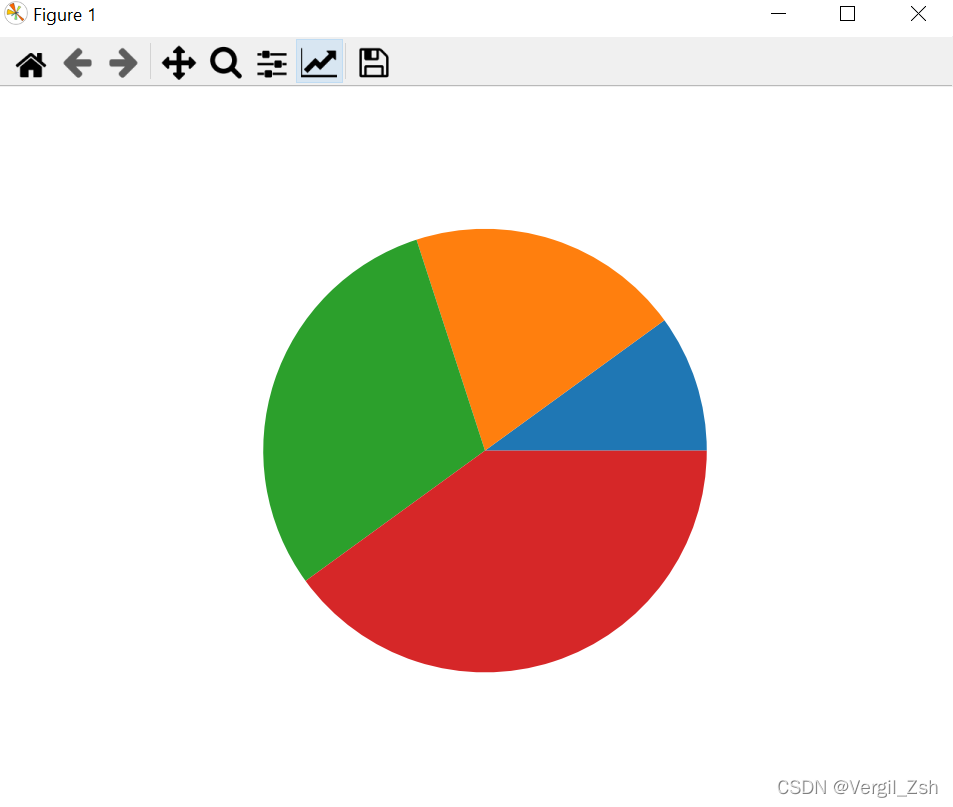
import numpy as np
import maplotlib.pyplot as plt
x = [1, 2, 3, 4]
plt.pie(x)
plt.show()
explode
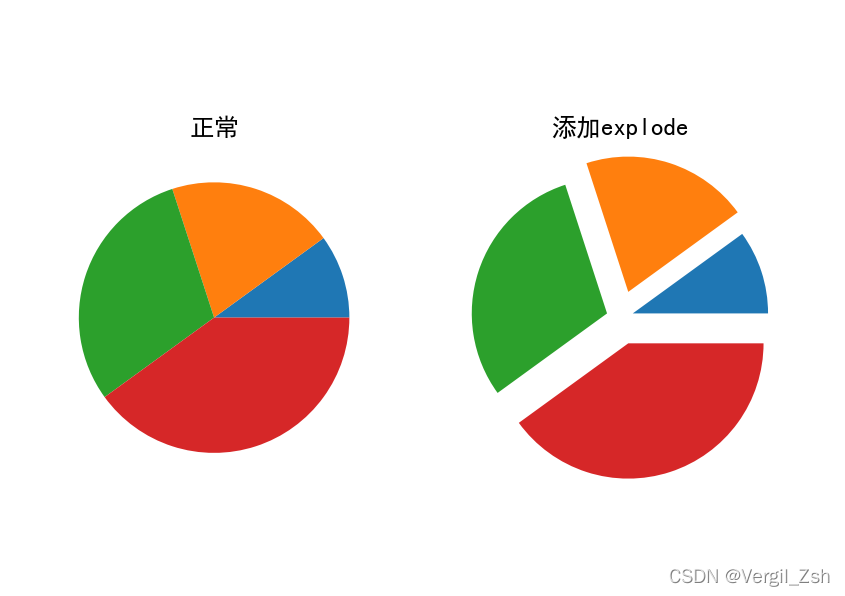
import numpy as np
import matplotlib.pyplot as plt

plt.rcParams['font.family'] = 'SimHei'
plt.rcParams['axes.unicode_minus']=False
x = [1, 2, 3, 4]
plt.subplot(121)
plt.title('正常')
plt.pie(x)
plt.subplot(122)
plt.title('添加explode')
plt.pie(x,explode=[0.1,0.2,0.1,0.2])
plt.show()
labels,labeldistance
import numpy as np
import matplotlib.pyplot as plt

plt.rcParams['font.family'] = 'SimHei'
plt.rcParams['axes.unicode_minus']=False
x = [15, 30, 45, 10]
plt.subplot(131)
plt.title('正常')
plt.pie(x)
plt.subplot(132)
plt.title('添加labels')
plt.pie(x,labels=['x1','y1','x2','y2'])
# labeldistance默认为是1.1
plt.subplot(133)
plt.title('添加labels和labeldistance')
plt.pie(x,labels=['x1','y1','x2','y2'],labeldistance=1.2)
plt.show()

colors
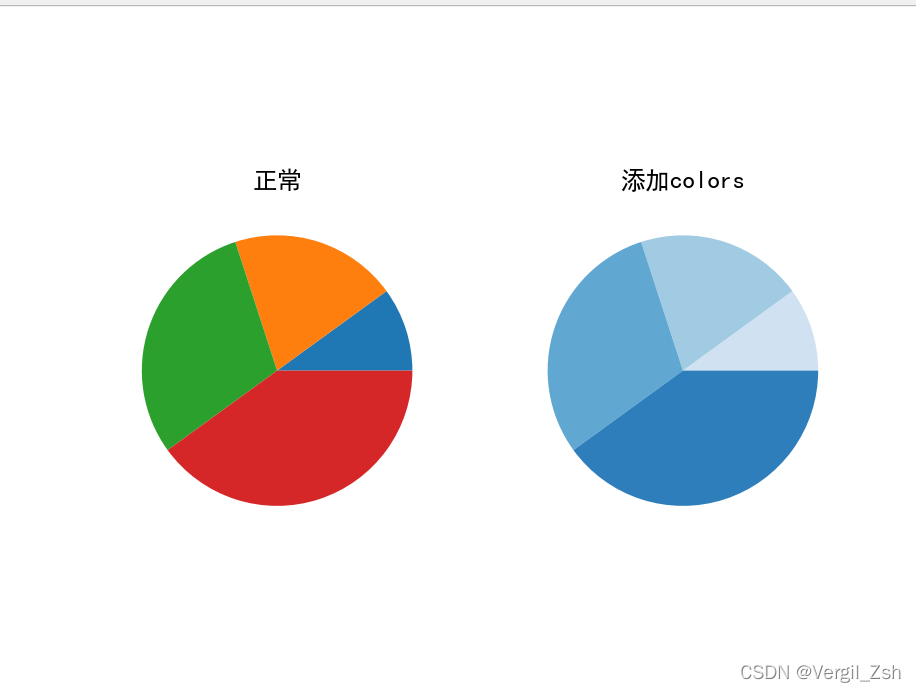
import numpy as np
import matplotlib.pyplot as plt

plt.rcParams['font.family'] = 'SimHei'
plt.rcParams['axes.unicode_minus']=False
x = [1, 2, 3, 4]
plt.subplot(121)
plt.title('正常')
plt.pie(x)
# 颜色参数必须保持和x长度一样
plt.subplot(122)
colors = plt.get_cmap('Blues')(np.linspace(0.2,0.7,len(x)))
print(colors)
plt.title('添加colors')
plt.pie(x,colors=colors)
plt.show()
autopct
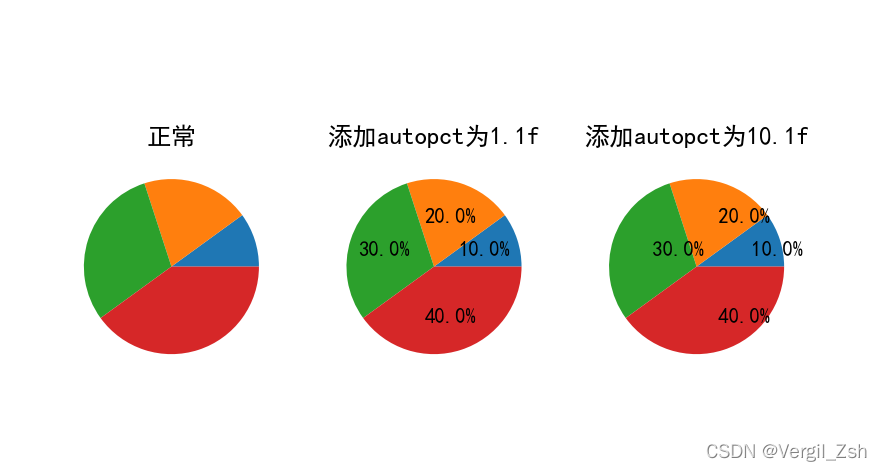
import numpy as np
import matplotlib.pyplot as plt

plt.rcParams['font.family'] = 'SimHei'
plt.rcParams['axes.unicode_minus']=False
x = [1, 2, 3, 4]
plt.subplot(131)
plt.title('正常')
plt.pie(x)
plt.subplot(132)
plt.title('添加autopct为1.1f')
plt.pie(x,autopct='%1.1f%%')
plt.subplot(133)
plt.title('添加autopct为10.1f')
plt.pie(x,autopct='%10.1f%%')
plt.show()
pctdistance
import numpy as np
import matplotlib.pyplot as plt

plt.figsize=((10,8))
plt.rcParams['font.family'] = 'SimHei'
plt.rcParams['axes.unicode_minus']=False
x = [1, 2, 3, 4]
plt.subplot(131)
plt.title('正常')
plt.pie(x)
plt.subplot(132)
plt.title('添加pctdistance默认值0.6')
plt.pie(x,autopct='%1.1f%%',pctdistance=0.6)
plt.subplot(133)
plt.title('添加pctdistance值1.5')
plt.pie(x,autopct='%1.1f%%',pctdistance=0.8)
plt.show()
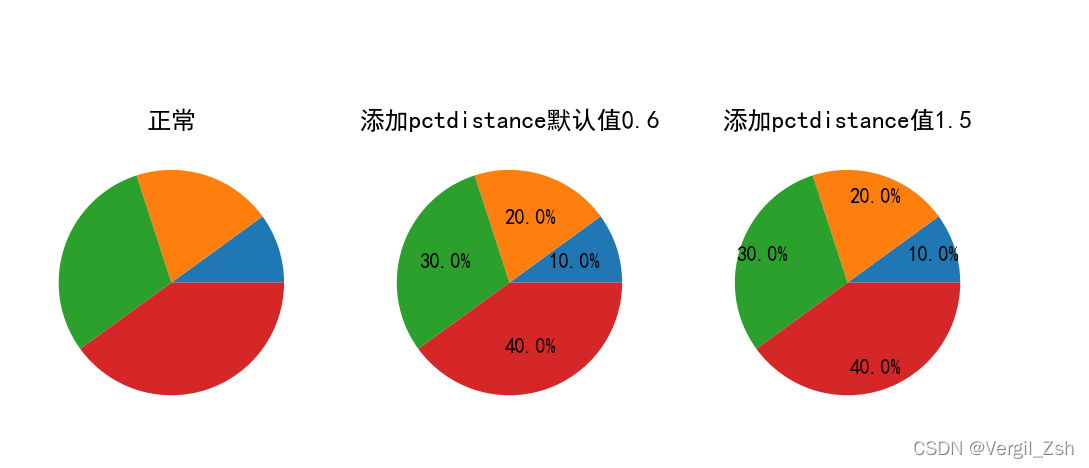
pctdistance和autopct设置都可以偏移百分比,一个是同方向偏移,一个是距中心点位置
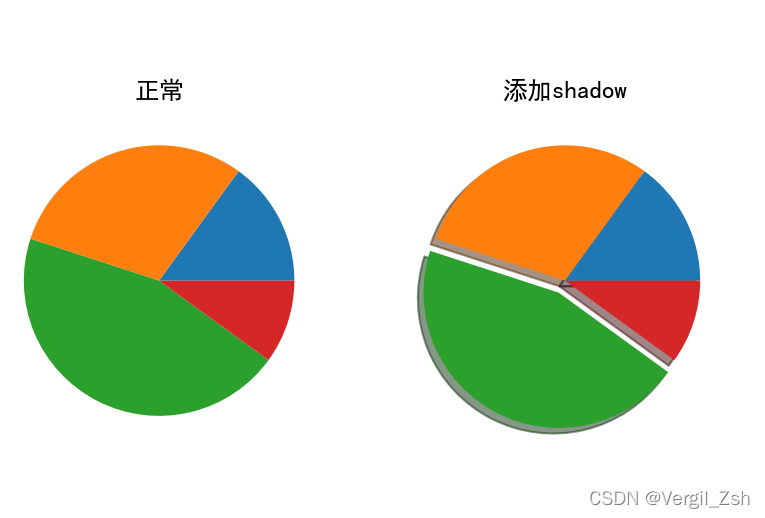
shadow
import numpy as np
import matplotlib.pyplot as plt

plt.rcParams['font.family'] = 'SimHei'
plt.rcParams['axes.unicode_minus']=False
x = [15, 30, 45, 10]
plt.subplot(121)
plt.title('正常')
plt.pie(x)
plt.subplot(122)
plt.title('添加shadow')
plt.pie(x,explode=(0,0,0.1,0),shadow=True)

plt.show()
startangle
import numpy as np
import matplotlib.pyplot as plt

plt.rcParams['font.family'] = 'SimHei'
plt.rcParams['axes.unicode_minus']=False
x = [15, 30, 45, 10]
plt.subplot(121)
plt.title('正常')
plt.pie(x,autopct='%1.1f%%')
# 起始角度设置
plt.subplot(122)
plt.title('设置startangle=90')
plt.pie(x,autopct='%1.1f%%',startangle=90)

plt.show()
radius
import numpy as np
import matplotlib.pyplot as plt

plt.rcParams['font.family'] = 'SimHei'
plt.rcParams['axes.unicode_minus']=False
x = [15, 30, 45, 10]
plt.subplot(121)
plt.title('正常')
plt.pie(x,autopct='%1.1f%%')
plt.subplot(122)
plt.title('设置radius=0.9')
plt.pie(x,autopct='%1.1f%%',radius=0.9)

plt.show()
counterclock
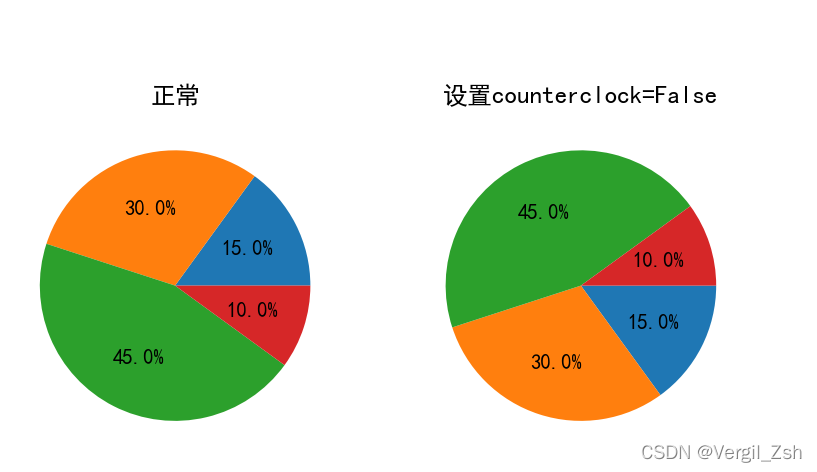
counterclock=False,设置饼图方向为逆方向
import numpy as np
import matplotlib.pyplot as plt

plt.rcParams['font.family'] = 'SimHei'
plt.rcParams['axes.unicode_minus']=False
x = [15, 30, 45, 10]
plt.subplot(121)
plt.title('正常')
plt.pie(x,autopct='%1.1f%%')
plt.subplot(122)
plt.title('设置counterclock=False')
plt.pie(x,autopct='%1.1f%%',counterclock=False)
plt.show()
wedgeprops
设置楔形的属性
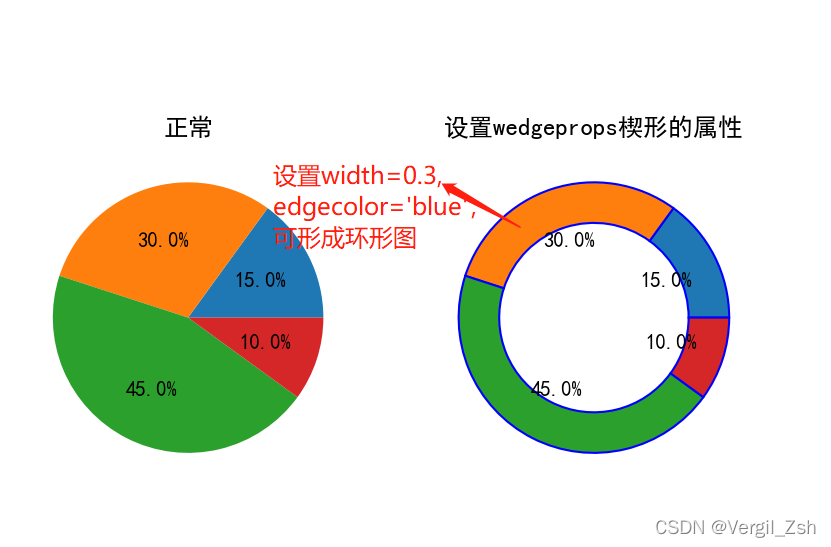
wedgeprops传入字典类型,width设置,可以转变为环形图,edgecolor设置其环形边缘颜色
import numpy as np
import matplotlib.pyplot as plt

plt.rcParams['font.family'] = 'SimHei'
plt.rcParams['axes.unicode_minus']=False
x = [15, 30, 45, 10]
plt.subplot(121)
plt.title('正常')
plt.pie(x,autopct='%1.1f%%')
plt.subplot(122)
plt.title('设置wedgeprops楔形的属性')
plt.pie(x,autopct='%1.1f%%',wedgeprops=dict(width=0.3, edgecolor='blue'))

plt.show()
textprops,center,frame
import numpy as np
import matplotlib.pyplot as plt

plt.rcParams['font.family'] = 'SimHei'
plt.rcParams['axes.unicode_minus']=False
x = [15, 30, 45, 10]
plt.subplot(131)
plt.title('正常')
plt.pie(x,autopct='%1.1f%%')
plt.subplot(132)
plt.title('设置textprops,center=1.1,frame')
plt.pie(x,autopct='%1.1f%%',textprops={'size': 'larger'},center=(1,1),frame=True)

plt.subplot(133)
plt.title('设置textprops,center=2.2,frame')
plt.pie(x,autopct='%1.1f%%',textprops={'size': 'x-large'},center=(2,2),frame=True)

plt.show()

rotatelabels,normalize
这里不多介绍,可根据上述自己检验,很少被用到
举例
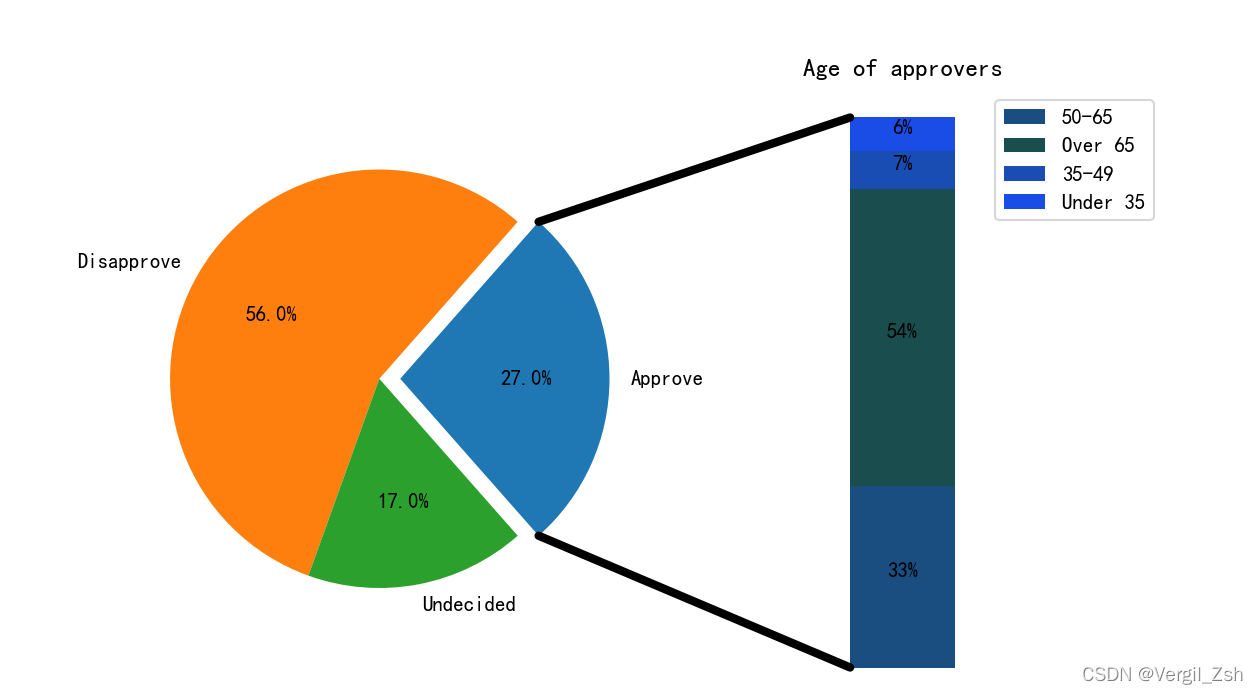
1.取饼图一部分楔形,添加colorbar
import matplotlib.pyplot as plt
from matplotlib.patches import ConnectionPatch
import numpy as np
fig, (ax1, ax2) = plt.subplots(1, 2, figsize=(9, 5))
fig.subplots_adjust(wspace=0)
ratios = [.27, .56, .17]
labels = ['Approve', 'Disapprove', 'Undecided']
explode = [0.1, 0, 0]
angle = -180 * ratios[0]
ax1.pie(ratios, autopct='%1.1f%%', startangle=angle,
        labels=labels, explode=explode)
xpos = 0
bottom = 0
ratios = [.33, .54, .07, .06]
width = .2
colors = [[.1, .3, .5], [.1, .3, .3], [.1, .3, .7], [.1, .3, .9]]
for j in range(len(ratios)):
    height = ratios[j]
    ax2.bar(xpos, height, width, bottom=bottom, color=colors[j])
    ypos = bottom + ax2.patches[j].get_height() / 2
    bottom += height
    ax2.text(xpos, ypos, "%d%%" % (ax2.patches[j].get_height() * 100),
             ha='center')
ax2.set_title('Age of approvers')
ax2.legend(('50-65', 'Over 65', '35-49', 'Under 35'))
ax2.axis('off')
ax2.set_xlim(- 2.5 * width, 2.5 * width)

theta1, theta2 = ax1.patches[0].theta1, ax1.patches[0].theta2
center, r = ax1.patches[0].center, ax1.patches[0].r
bar_height = sum([item.get_height() for item in ax2.patches])
# draw top connecting line
x = r * np.cos(np.pi / 180 * theta2) + center[0]
y = r * np.sin(np.pi / 180 * theta2) + center[1]
con = ConnectionPatch(xyA=(-width / 2, bar_height), coordsA=ax2.transData,
                      xyB=(x, y), coordsB=ax1.transData)
con.set_color([0, 0, 0])
con.set_linewidth(4)
ax2.add_artist(con)
# draw bottom connecting line
x = r * np.cos(np.pi / 180 * theta1) + center[0]
y = r * np.sin(np.pi / 180 * theta1) + center[1]
con = ConnectionPatch(xyA=(-width / 2, 0), coordsA=ax2.transData,
                      xyB=(x, y), coordsB=ax1.transData)
con.set_color([0, 0, 0])
ax2.add_artist(con)
con.set_linewidth(4)
plt.show()
2.环形图
import numpy as np
import matplotlib.pyplot as plt
fig, ax = plt.subplots()
size = 0.3
vals = np.array([[60., 32.], [37., 40.], [29., 10.]])
cmap = plt.cm.Set1
outer_colors = cmap(np.arange(3)*4)
inner_colors = cmap([1, 2, 5, 6, 9, 10])
ax.pie(vals.sum(axis=1), radius=1, colors=outer_colors,
       wedgeprops=dict(width=size, edgecolor='w'))
ax.pie(vals.flatten(), radius=1-size, colors=inner_colors,
       wedgeprops=dict(width=size, edgecolor='w'))
ax.set(aspect="equal", title='Pie plot with `ax.pie`')
plt.show()

总结
本篇文章就到这里了,希望能够给你带来帮助,也希望您能够多多关注脚本之家的更多内容!


最新评论