基于Vue+Echart绘制动态图
需求分析
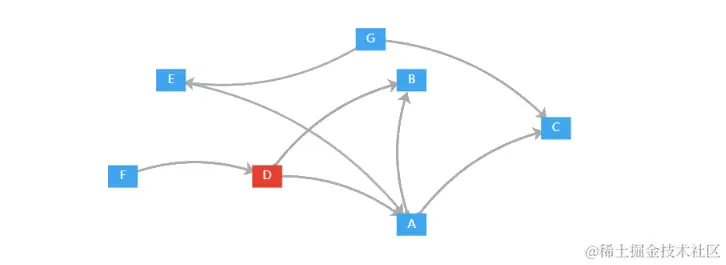
用户需要展示他的数据库是有哪个数据库转化的,需要展示数据库的轨迹图,前导库的关系图。
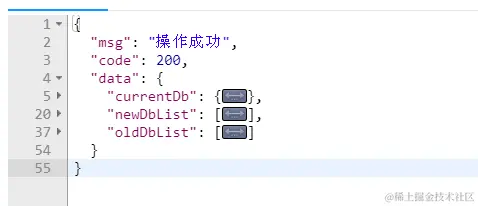
后端接口返回的格式
传入当前的数据库(节点)的id

接口返回
currentDb是当前数据库(节点)的信息 Object
newDbList当前数据库(节点)的后继数据库(节点)Array
oldDbList当前数据库(节点)的前导数据库(节点)Array
前端需要实现的效果
第一次展示当前数据库(节点)以及前导数据库(节点)和后继数据库(节点)
当鼠标悬浮在某个数据库(节点)的时候,再在此基础上渲染悬浮的数据库(节点)以及前导数据库(节点)和后继数据库(节点)

解决方法
关系图的setOption
如下
 const chartOptions = {
        title: {
          text: '前导库关系图',
        },
//鼠标悬浮的时候展示的内容
        tooltip: {
          formatter: function (params) {
            return `名称: ${params.data.name}<br>
                      别名: ${params.data.info?.dbNickName || '无'}<br>
                      所在平台:${params.data.info?.datasourceSystemName || '无'}<br>
                      数据库类型:${params.data.info?.dbType || '无'}<br>
                      备注:${params.data.info?.remark || '无'}
  `;
          }
        },
        series: [
          {
            type: 'graph',
            layout: 'none',
            animation: false,
            roam: true,
            label: {
              show: true,
            },
            force: {
              gravity: 0,
              repulsion: 1000,
              edgeLength: 5
            },
            edgeSymbol: ['circle', 'arrow'], // 使用箭头作为边的符号
            edgeSymbolSize: [4, 10],
            edgeLabel: {
              fontSize: 12,
            },
            data: this.nodes,
            links: this.links,
            lineStyle: {
              opacity: 0.9,
              width: 2,
              curveness: 0,
              // 添加箭头配置
              arrow: {
                type: 'arrow', // 箭头的类型
                size: 8, // 箭头的大小
                arrowOffset: 10, // 箭头偏移位置
              },
            },
            emphasis: {
              focus: 'adjacency',
              link: {
                show: true,
              },
              handleSize: 6,
            },
          },
        ],
};参考echart官网https://echarts.apache.org/zh/index.html 可以查看配置的相关解释,此处不过多解释
准备第一次渲染 需要的数据 函数
 prepareData(data) {
      // 当前节点
      const currentNode = [
        {
          id: data.currentDb.id,
          name: data.currentDb.dbName,
          info: data.currentDb,
          x: 400,
          y: 100,
          symbol: 'rect', // 使用矩形作为节点的形状
          symbolSize: [40, 30], // 设置矩形节点的大小
          itemStyle: {
            color: '#e63f32'
          },
        }
      ]
      this.nodePosition(currentNode)
      this.currentId = data.currentDb.id;
      // 根据父组件传递的数据创建节点
      if (data.newDbList) {
        const gridSize = 60; // 网格大小
        const newNodes = data.newDbList.map((item, index) => {
          // let indexNew=index+1;
          const yOffset = data.newDbList.length === 1 ? 0 : (index % 2 === 0 ? 20 : -20) * (index + 1);
          return {
            id: item.id,
            info: item,
            name: item.dbName,
            x: 400 + gridSize,
            y: 100 + yOffset,
            symbol: 'rect', // 使用矩形作为节点的形状
            symbolSize: [40, 30], // 设置矩形节点的大小
            itemStyle: {
              color: '#41a5ee'
            },
          }
        })
        this.nodePosition(newNodes)
        const newLinks = data.newDbList.map((link) => (
          {
            source: data.currentDb.id.toString(),
            target: link.id.toString(),
            lineStyle: {
              normal: {
                curveness: 0.2, // 调整曲线的弯曲度
              },
            },
          }
        ))
        this.links = [
          ...this.links,
          ...newLinks
        ]
      }
      if (data.oldDbList) {
        const gridSize = 60; // 网格大小
        const oldNodes = data.oldDbList.map((item, index) => {
          // let indexNew=index+1;
          const yOffset = data.oldDbList.length === 1 ? 0 : (index % 2 === 0 ? 20 : -20) * (index + 1);
          return {
            id: item.id,
            info: item,
            name: item.dbName,
            x: 400 - gridSize,
            y: 100 + yOffset,
            symbol: 'rect', // 使用矩形作为节点的形状
            symbolSize: [40, 30], // 设置矩形节点的大小
            itemStyle: {
              color: '#41a5ee'
            },
          };
        })
        this.nodePosition(oldNodes)
        const oldLinks = data.oldDbList.map((link) => (
          {
            source: link.id.toString(),
            target: data.currentDb.id.toString(),
            lineStyle: {
              normal: {
                curveness: 0.2, // 调整曲线的弯曲度
              },
            },
          }
        ))
        this.links = [
          ...this.links,
          ...oldLinks
        ]
      }
    },
注:此处使用曲线的原因是因为曲线可以大大降低 两个节点的连线通过第三个节点的问题 ,造成展示错误(没有做link连线的判定)
结算新节点的位置 函数
输入参数nodes是存储节点的数组
 // 计算节点位置并添加节点
    nodePosition(nodes) {
      nodes.forEach(node => {
        const originalPositionKey = `${node.x}_${node.y}`;
        let positionKey = originalPositionKey;
        while (this.nodePositions.has(positionKey)) {
          const randomValue = Math.floor(Math.random() * 81) - 40;
          node.x += randomValue;
          node.y += randomValue;
          positionKey = `${node.x}_${node.y}`;
        }
        this.nodePositions.add(positionKey);
        this.nodes.push(node);
      });
    },
具体逻辑:先判断当前节点位置是否已经存在,如果存在,则利用随机数在存在的位置上偏移一定的值 ,再存储。
节点位置存储方式x_y
nodePositions: new Set(), // 使用 Set 来存储节点位置信息
处理新节点信息的函数
  changeData(data) {
      console.log('data.currentDb', data.currentDb)
      // 当前节点的x,y值
      const currentX = data.currentDb.x;
      const currentY = data.currentDb.y;
      if (data.newDbList) {
        const newNodes=[]
        // 使用Set来创建一个唯一节点ID的集合
        const existingNodeIds = new Set(this.nodes.map(node => node.id));
        const gridSize = 60; // 网格大小
        data.newDbList.map((item, index) => {
          const yOffset = data.newDbList.length === 1 ? 0 : (index % 2 === 0 ? 20 : -20) * (index + 1);
          const newNode = {
            id: item.id,
            info: item,
            name: item.dbName,
            x: currentX + gridSize,
            y: currentY + yOffset,
            symbol: 'rect', // 使用矩形作为节点的形状
            symbolSize: [40, 30], // 设置矩形节点的大小
            itemStyle: {
              color: '#41a5ee'
            }
          }
          if (!existingNodeIds.has(item.id)) {
            newNodes.push(newNode)
          } else {
          }
          this.nodePosition(newNodes)
        })
        const newLinks = data.newDbList.map((link) => (
          {
            source: data.currentDb.id.toString(),
            target: link.id.toString(),
            lineStyle: {
              normal: {
                curveness: 0.2, // 调整曲线的弯曲度
              },
            },
          }
        ))
        this.links = [
          ...this.links,
          ...newLinks
        ]
      }
      if (data.oldDbList) {
        const oldNodes=[]
        // 使用Set来创建一个唯一节点ID的集合
        const existingNodeIds = new Set(this.nodes.map(node => node.id));
        console.log('existingNodeIds', existingNodeIds)
        const gridSize = 60; // 网格大小
        data.oldDbList.map((item, index) => {
          const yOffset = data.oldDbList.length === 1 ? 0 : (index % 2 === 0 ? 20 : -20);
          const newNode = {
            id: item.id,
            info: item,
            name: item.dbName,
            x: currentX - gridSize,
            y: currentY + yOffset,
            symbol: 'rect', // 使用矩形作为节点的形状
            symbolSize: [40, 30], // 设置矩形节点的大小
            itemStyle: {
              color: '#41a5ee'
            },
          }
          if (!existingNodeIds.has(item.id)) {
            // 如果新节点的ID不存在于现有节点中,添加新节点
            oldNodes.push(newNode);
          } else {
          }
          this.nodePosition(oldNodes)
        })
        const oldLinks = data.oldDbList.map((link) => (
          {
            source: link.id.toString(),
            target: data.currentDb.id.toString(),
            lineStyle: {
              normal: {
                curveness: 0.2, // 调整曲线的弯曲度
              },
            },
          }
        ))
        this.links = [
          ...this.links,
          ...oldLinks
        ]
      }
},与prepareData函数内容差不多 ,作者此处还未做代码整合
悬浮在节点上方时的处理函数
 updateNode() {
      this.myChart.on('mouseover', (params) => {
        if (params.dataType === 'node') {
          const currentData = params.data;
          // 先隐藏所有节点的 label
          this.nodes.forEach(node => {
            if (node.label) {
              node.label.show = false;
            }
          });
          // 显示当前节点的 label
          if (currentData.label) {
            currentData.label.show = true;
          }
          databaseRelation(currentData.id).then(res => {
            if (res.code === 200) {
              const data = {
                ...res.data,
                currentDb: params.data,
              }
              this.changeData(data)
              this.drawChart();
            } else {
              this.$message(res.msg)
            }
          })
          console.log('params', params.data)
        }
      });
}databaseRelation是作者项目的后端请求,请根据自己实际情况调整
主要是通过改变setOption里面的data来改变当前的图
完整代码
<template>
  <div>
    <div id="chart-container" style="height: 400px;"></div>
  </div>
</template>
<script>
import echarts from 'echarts'
import { databaseRelation } from '@/api/qysj/app/rawData/Database'
export default {
  props: {
    data: Object,
  },
  data() {
    return {
      myChart: null,
      nodes: [
      ],
      links: [
      ],
      nodePositions: new Set(), // 使用 Set 来存储节点位置信息
      // 当前节点id
      currentId: null
    };
  },
  mounted() {
    console.log('当前的节点', this.data.currentDb)
    console.log('第一次的节点', this.data)
    const chartContainer = this.$el.querySelector('#chart-container');
    this.myChart = echarts.init(chartContainer);
    this.myChart.clear();
    this.prepareData(this.data); // 准备节点和链接数据
    this.drawChart();
    this.updateNode()
  },
  methods: {
    // 准备节点和链接数据
    prepareData(data) {
      // 当前节点
      const currentNode = [
        {
          id: data.currentDb.id,
          name: data.currentDb.dbName,
          info: data.currentDb,
          x: 400,
          y: 100,
          symbol: 'rect', // 使用矩形作为节点的形状
          symbolSize: [40, 30], // 设置矩形节点的大小
          itemStyle: {
            color: '#e63f32'
          },
        }
      ]
      this.nodePosition(currentNode)
      this.currentId = data.currentDb.id;
      // 根据父组件传递的数据创建节点
      if (data.newDbList) {
        const gridSize = 60; // 网格大小
        const newNodes = data.newDbList.map((item, index) => {
          // let indexNew=index+1;
          const yOffset = data.newDbList.length === 1 ? 0 : (index % 2 === 0 ? 20 : -20) * (index + 1);
          return {
            id: item.id,
            info: item,
            name: item.dbName,
            x: 400 + gridSize,
            y: 100 + yOffset,
            symbol: 'rect', // 使用矩形作为节点的形状
            symbolSize: [40, 30], // 设置矩形节点的大小
            itemStyle: {
              color: '#41a5ee'
            },
          }
        })
        this.nodePosition(newNodes)
        const newLinks = data.newDbList.map((link) => (
          {
            source: data.currentDb.id.toString(),
            target: link.id.toString(),
            lineStyle: {
              normal: {
                curveness: 0.2, // 调整曲线的弯曲度
              },
            },
          }
        ))
        this.links = [
          ...this.links,
          ...newLinks
        ]
      }
      if (data.oldDbList) {
        const gridSize = 60; // 网格大小
        const oldNodes = data.oldDbList.map((item, index) => {
          // let indexNew=index+1;
          const yOffset = data.oldDbList.length === 1 ? 0 : (index % 2 === 0 ? 20 : -20) * (index + 1);
          return {
            id: item.id,
            info: item,
            name: item.dbName,
            x: 400 - gridSize,
            y: 100 + yOffset,
            symbol: 'rect', // 使用矩形作为节点的形状
            symbolSize: [40, 30], // 设置矩形节点的大小
            itemStyle: {
              color: '#41a5ee'
            },
          };
        })
        this.nodePosition(oldNodes)
        const oldLinks = data.oldDbList.map((link) => (
          {
            source: link.id.toString(),
            target: data.currentDb.id.toString(),
            lineStyle: {
              normal: {
                curveness: 0.2, // 调整曲线的弯曲度
              },
            },
          }
        ))
        this.links = [
          ...this.links,
          ...oldLinks
        ]
      }
    },
    changeData(data) {
      console.log('data.currentDb', data.currentDb)
      // 当前节点的x,y值
      const currentX = data.currentDb.x;
      const currentY = data.currentDb.y;
      if (data.newDbList) {
        const newNodes=[]
        // 使用Set来创建一个唯一节点ID的集合
        const existingNodeIds = new Set(this.nodes.map(node => node.id));
        const gridSize = 60; // 网格大小
        data.newDbList.map((item, index) => {
          const yOffset = data.newDbList.length === 1 ? 0 : (index % 2 === 0 ? 20 : -20) * (index + 1);
          const newNode = {
            id: item.id,
            info: item,
            name: item.dbName,
            x: currentX + gridSize,
            y: currentY + yOffset,
            symbol: 'rect', // 使用矩形作为节点的形状
            symbolSize: [40, 30], // 设置矩形节点的大小
            itemStyle: {
              color: '#41a5ee'
            }
          }
          if (!existingNodeIds.has(item.id)) {
            newNodes.push(newNode)
          } else {
          }
          this.nodePosition(newNodes)
        })
        const newLinks = data.newDbList.map((link) => (
          {
            source: data.currentDb.id.toString(),
            target: link.id.toString(),
            lineStyle: {
              normal: {
                curveness: 0.2, // 调整曲线的弯曲度
              },
            },
          }
        ))
        this.links = [
          ...this.links,
          ...newLinks
        ]
      }
      if (data.oldDbList) {
        const oldNodes=[]
        // 使用Set来创建一个唯一节点ID的集合
        const existingNodeIds = new Set(this.nodes.map(node => node.id));
        console.log('existingNodeIds', existingNodeIds)
        const gridSize = 60; // 网格大小
        data.oldDbList.map((item, index) => {
          const yOffset = data.oldDbList.length === 1 ? 0 : (index % 2 === 0 ? 20 : -20);
          const newNode = {
            id: item.id,
            info: item,
            name: item.dbName,
            x: currentX - gridSize,
            y: currentY + yOffset,
            symbol: 'rect', // 使用矩形作为节点的形状
            symbolSize: [40, 30], // 设置矩形节点的大小
            itemStyle: {
              color: '#41a5ee'
            },
          }
          if (!existingNodeIds.has(item.id)) {
            // 如果新节点的ID不存在于现有节点中,添加新节点
            oldNodes.push(newNode);
          } else {
          }
          this.nodePosition(oldNodes)
        })
        const oldLinks = data.oldDbList.map((link) => (
          {
            source: link.id.toString(),
            target: data.currentDb.id.toString(),
            lineStyle: {
              normal: {
                curveness: 0.2, // 调整曲线的弯曲度
              },
            },
          }
        ))
        this.links = [
          ...this.links,
          ...oldLinks
        ]
      }
    },
    // 计算节点位置并添加节点
    nodePosition(nodes) {
      nodes.forEach(node => {
        const originalPositionKey = `${node.x}_${node.y}`;
        let positionKey = originalPositionKey;
        while (this.nodePositions.has(positionKey)) {
          const randomValue = Math.floor(Math.random() * 81) - 40;
          node.x += randomValue;
          node.y += randomValue;
          positionKey = `${node.x}_${node.y}`;
        }
        this.nodePositions.add(positionKey);
        this.nodes.push(node);
      });
    },
    drawChart() {
      console.log('this.nodes', this.nodes)
      console.log('this.links', this.links)
      const chartOptions = {
        title: {
          text: '前导库关系图',
        },
        tooltip: {
          formatter: function (params) {
            return `名称: ${params.data.name}<br>
                      别名: ${params.data.info?.dbNickName || '无'}<br>
                      所在平台:${params.data.info?.datasourceSystemName || '无'}<br>
                      数据库类型:${params.data.info?.dbType || '无'}<br>
                      备注:${params.data.info?.remark || '无'}
  `;
          }
        },
        series: [
          {
            type: 'graph',
            layout: 'none',
            //   layout: 'force',
            animation: false,
            // data: [this.createTreeData()], // 树状布局需要提供一个树形结构的数据
            roam: true,
            label: {
              show: true,
            },
            force: {
              // initLayout: 'circular'
              gravity: 0,
              repulsion: 1000,
              edgeLength: 5
            },
            edgeSymbol: ['circle', 'arrow'], // 使用箭头作为边的符号
            edgeSymbolSize: [4, 10],
            edgeLabel: {
              fontSize: 12,
            },
            data: this.nodes,
            links: this.links,
            lineStyle: {
              opacity: 0.9,
              width: 2,
              curveness: 0,
              // 添加箭头配置
              arrow: {
                type: 'arrow', // 箭头的类型
                size: 8, // 箭头的大小
                arrowOffset: 10, // 箭头偏移位置
              },
            },
            emphasis: {
              focus: 'adjacency',
              link: {
                show: true,
              },
              handleSize: 6,
            },
          },
        ],
      };
      this.myChart.setOption(chartOptions);
    },
    updateNode() {
      this.myChart.on('mouseover', (params) => {
        if (params.dataType === 'node') {
          const currentData = params.data;
          // 先隐藏所有节点的 label
          this.nodes.forEach(node => {
            if (node.label) {
              node.label.show = false;
            }
          });
          // 显示当前节点的 label
          if (currentData.label) {
            currentData.label.show = true;
          }
          databaseRelation(currentData.id).then(res => {
            if (res.code === 200) {
              const data = {
                ...res.data,
                currentDb: params.data,
              }
              console.log('data', data)
              this.changeData(data)
              this.drawChart();
              // this.myChart.setOption(chartOptions);
            } else {
              this.$message(res.msg)
            }
          })
          console.log('params', params.data)
        }
      });
    }
  },
};
</script>
以上就是基于Vue+Echart绘制动态图的详细内容,更多关于Vue Echart动态图的资料请关注脚本之家其它相关文章!
相关文章

vue2.0 + element UI 中 el-table 数据导出Excel的方法
下面小编就为大家分享一篇vue2.0 + element UI 中 el-table 数据导出Excel的方法,具有很好的参考价值,希望对大家有所帮助。一起跟随小编过来看看吧2018-03-03
vue-cli脚手架config目录下index.js配置文件的方法
下面小编就为大家分享一篇vue-cli脚手架config目录下index.js配置文件的方法,具有很好的参考价值,希望对大家有所帮助。一起跟随小编过来看看吧2018-03-03


最新评论