vue使用echarts实现动态数据的示例详解
echarts 中有一个图形叫动态数据+时间坐标轴,这个一般用于我们图形数据较多,或需要左侧平移动态展示折线图或者其他图形的情况,但是使用这个的时候,一般数据没问题,如果碰上我这种同一个x轴上,有两个值的情况就比较麻烦。 下面分享一下。
官方案例: echarts.apache.org/examples/zh/editor.html

场景
我们的场景就是同样有一批数据,需要不断的左移显示, x 轴显示站点, y轴显示我这个站的压力值, 正常来说我一个站有两个压力值, 但是经常会有这两个值相同的情况,相同的时候,就显示一个点, 不相同的时候,就在同一个 x 轴上显示两个点。 官方给我们的代码 是使用 定时器轮询,来更新数据

但是官方的代码不是循环的,他这个更新你看到了 shift 删除了第一项,这个第一项就没了, 而我的需求是像轮播图一样, 要循环数据, 也就是删除的第一项要插回到数据的最后一条去。
数据
我觉得这里应该先给大家展示数据, 然后根据数据再展开就方便理解了。
         allData: [
        {
          showx: '节点1',
          showy: 7.40019,
          value: ['节点1', 7.40019],
          source: {
            stationName: '节点1',
            pressureIn: 7.40019,
            pressureOut: 7.40019,
            same: true,
          },
        },
        {
          showx: '节点2',
          showy: 4.673716,
          value: ['节点2', 4.673716],
          source: {
            stationName: '节点2',
            pressureIn: 4.673716,
            pressureOut: 7.477946,
            same: false,
            type: 'pressureOut',
          },
        },
        {
          showx: '节点2',
          showy: 7.477946,
          value: ['节点2', 7.477946],
          source: {
            stationName: '节点2',
            pressureIn: 4.673716,
            pressureOut: 7.477946,
            same: false,
            type: 'pressureOut',
          },
        },
        {
          showx: '节点3',
          showy: 6.699683,
          value: ['节点3', 6.699683],
          source: {
            stationName: '节点3',
            pressureIn: 6.699683,
            pressureOut: 7.928933,
            same: false,
            type: 'pressureOut',
          },
        },
        {
          showx: '节点3',
          showy: 7.928933,
          value: ['节点3', 7.928933],
          source: {
            stationName: '节点3',
            pressureIn: 6.699683,
            pressureOut: 7.928933,
            same: false,
            type: 'pressureOut',
          },
        },
        {
          showx: '节点4',
          showy: 10,
          value: ['节点4', 10],
          source: {
            stationName: '节点4',
            pressureIn: 10,
            pressureOut: 10,
            same: true,
          },
        },
        {
          showx: '节点5',
          showy: 7.514252,
          value: ['节点5', 7.514252],
          source: {
            stationName: '节点5',
            pressureIn: 7.514252,
            pressureOut: 7.514252,
            same: true,
          },
        },
        {
          showx: '节点8',
          showy: 8.152734,
          value: ['节点8', 8.152734],
          source: {
            stationName: '节点8',
            pressureIn: 8.152734,
            pressureOut: 8.152734,
            same: true,
          },
        },
        {
          showx: '节点9',
          showy: 7.925224,
          value: ['节点9', 7.925224],
          source: {
            stationName: '节点9',
            pressureIn: 7.925224,
            pressureOut: 8.410707,
            same: false,
            type: 'pressureOut',
          },
        },
        {
          showx: '节点9',
          showy: 8.410707,
          value: ['节点9', 8.410707],
          source: {
            stationName: '节点9',
            pressureIn: 7.925224,
            pressureOut: 8.410707,
            same: false,
            type: 'pressureOut',
          },
        },
        {
          showx: '节点11',
          showy: 7.309628,
          value: ['节点11', 7.309628],
          source: {
            stationName: '节点11',
            pressureIn: 7.309628,
            pressureOut: 7.309628,
            same: true,
          },
        },
      ]
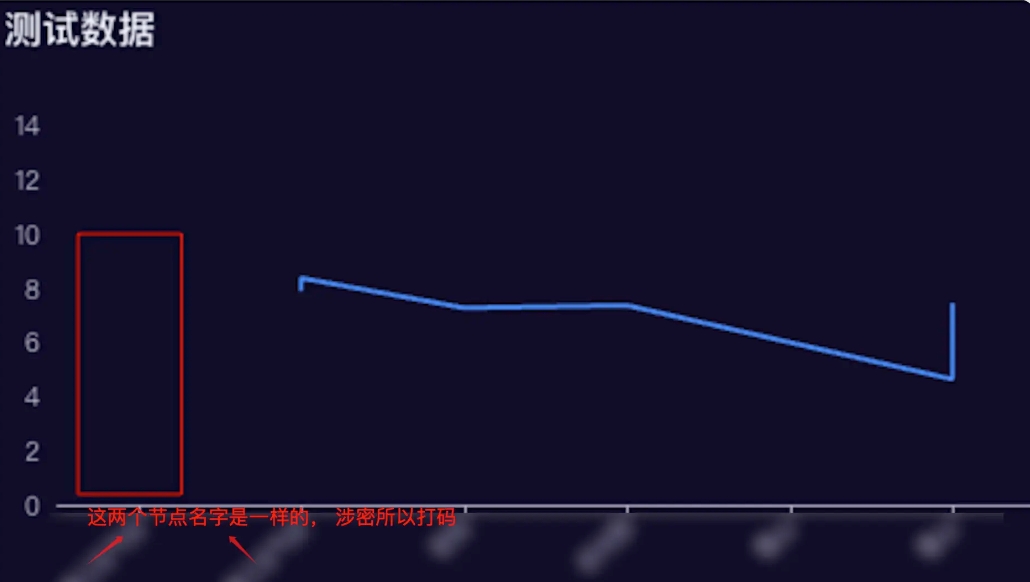
上面就是我的数据, 实际上这个数据已经经过我的改造了, 那么正常来讲 官方示例当中,是不会出现我这里面比如节点3这种 重复节点的情况, 这时候往左侧平移是一点问题没有的, 但如果我这个里面有重复的节点, 而我使用正常左移1个,然后再把左移这个插回到数组最后一个会怎么样? 会这样:

大家可以看到, 当我滚动到有两个重复节点的时候,左侧会出现一个空位, 而我的需求是需要再 x 轴上显示 一个节点,两个值, 这两个值在一条x轴上, 方便看到变化。 出现这个问题的原因就是我移动了一个节点, 但这两个节点实际上是显示在一条x轴上的, 移走了一个, 只剩下另一个,就不能够正常显示。 所以我移动节点的时候,应该判断左移出去的节点是否是重复节点,如果是,应该两个都删除,然后插入到我数组的后面。
这里还有一个注意点,就是我们需要使用两个数据来管理状态,因为不像官方的 demo,我这里要对数组删除以后,还要插入,需要找到指定的数据,所以一个数组存储不变状态,我们从这里拿指定的数据,另一个数组用来展示,这个数组可以删除,更改。同时需要一个 index, 来记录我们每次拿取数据的指针。
最终效果

代码
以下是我的完整代码, 可以直接使用, 看到效果, 关键逻辑也有注释, 然后有疑问的地方,大家可以留言,一起讨论~ pipelinePressureData 这里面的逻辑大家可以不用看,这是我用来转换数据用的。
<template>
  <div>
    <div id="demo-main"></div>
  </div>
</template>
<script>
import * as echarts from 'echarts';

export default {
  props:{
    pipelinePressureData:{
      type: Array,
      default: () => []
    }
  },
  name: 'PipelinePressureChart',
  data(){
    return {
          showData:[ ],
          lastIndex: 0,
          timeID: 0,
          allData: [
        {
          showx: '节点1',
          showy: 7.40019,
          value: ['节点1', 7.40019],
          source: {
            stationName: '节点1',
            pressureIn: 7.40019,
            pressureOut: 7.40019,
            same: true,
          },
        },
        {
          showx: '节点2',
          showy: 4.673716,
          value: ['节点2', 4.673716],
          source: {
            stationName: '节点2',
            pressureIn: 4.673716,
            pressureOut: 7.477946,
            same: false,
            type: 'pressureOut',
          },
        },
        {
          showx: '节点2',
          showy: 7.477946,
          value: ['节点2', 7.477946],
          source: {
            stationName: '节点2',
            pressureIn: 4.673716,
            pressureOut: 7.477946,
            same: false,
            type: 'pressureOut',
          },
        },
        {
          showx: '节点3',
          showy: 6.699683,
          value: ['节点3', 6.699683],
          source: {
            stationName: '节点3',
            pressureIn: 6.699683,
            pressureOut: 7.928933,
            same: false,
            type: 'pressureOut',
          },
        },
        {
          showx: '节点3',
          showy: 7.928933,
          value: ['节点3', 7.928933],
          source: {
            stationName: '节点3',
            pressureIn: 6.699683,
            pressureOut: 7.928933,
            same: false,
            type: 'pressureOut',
          },
        },
        {
          showx: '节点4',
          showy: 10,
          value: ['节点4', 10],
          source: {
            stationName: '节点4',
            pressureIn: 10,
            pressureOut: 10,
            same: true,
          },
        },
        {
          showx: '节点5',
          showy: 7.514252,
          value: ['节点5', 7.514252],
          source: {
            stationName: '节点5',
            pressureIn: 7.514252,
            pressureOut: 7.514252,
            same: true,
          },
        },
        {
          showx: '节点8',
          showy: 8.152734,
          value: ['节点8', 8.152734],
          source: {
            stationName: '节点8',
            pressureIn: 8.152734,
            pressureOut: 8.152734,
            same: true,
          },
        },
        {
          showx: '节点9',
          showy: 7.925224,
          value: ['节点9', 7.925224],
          source: {
            stationName: '节点9',
            pressureIn: 7.925224,
            pressureOut: 8.410707,
            same: false,
            type: 'pressureOut',
          },
        },
        {
          showx: '节点9',
          showy: 8.410707,
          value: ['节点9', 8.410707],
          source: {
            stationName: '节点9',
            pressureIn: 7.925224,
            pressureOut: 8.410707,
            same: false,
            type: 'pressureOut',
          },
        },
        {
          showx: '节点11',
          showy: 7.309628,
          value: ['节点11', 7.309628],
          source: {
            stationName: '节点11',
            pressureIn: 7.309628,
            pressureOut: 7.309628,
            same: true,
          },
        },
      ]
    }
  },
  mounted(){
  },
  beforeDestroy(){
    clearInterval(this.timeID)
  },
  watch:{
    pipelinePressureData:{
      deep: true,
      immediate: true,
      handler(val){
        if(val?.length === 0 ) return
        const res = val.reduce((prev,item)=>{
          const { pressureIn, pressureOut, stationName} = item
          if(pressureIn === pressureOut){
            prev.push({
              showx: stationName,
              showy: pressureIn,
              value: [stationName,pressureIn],
              source: Object.assign(item, { same: true })
            })
          }else{
            prev.push({
              showx: stationName,
              showy: pressureIn,
              value: [stationName,pressureIn],
              source:  Object.assign(item, { same: false, type: 'pressureIn' })
            })
            prev.push({
              showx: stationName,
              showy: pressureOut,
              value: [stationName,pressureOut],
              source: Object.assign(item, { same: false, type: 'pressureOut' })
            })
          }
          return prev
        },[])
        // this.allData = res
        console.log('res',res);
        this.$nextTick(()=>{
          this.init()
        })
      }
    }
  },
  methods: {
    init(){
      var chartDom = document.getElementById('demo-main');
      var myChart = echarts.init(chartDom, 'dark', {
        useDirtyRect: true
      });
      var option;
      const allIndxe = this.allData.length
      const bool = allIndxe > 6
      if(bool){
        this.showData = this.allData.slice(0,6)
        this.lastIndex = 5
      }else{
        this.showData = this.allData
      }
      option = {
        grid: {
          left: '2%',  // 如果需要,可以调整左边距
          right: '1%', // 如果需要,可以调整右边距
          bottom: '3%', // 增加底部边距以容纳更多的 X 轴标签
          containLabel: true // 确保标签被容纳在图表区域内
        },
        title: {
          text: '测试数据'
        },
        tooltip: {
          trigger: 'axis',
          formatter: function (params) {
            params = params[0];
            const { data: { source } } = params
            const { same, stationName, type, pressureIn, pressureOut } = source
            return `<div>场站${stationName}</div><div>进压力${pressureIn}</div><div>出压力${pressureOut}</div>`
          },
          axisPointer: {
            animation: false
          }
        },
        xAxis: {
          type: 'category',
          name: '名称',
          splitLine: {
            show: false
          },
          axisTick: {
            alignWithLabel: true
          },
          axisLabel: {
            formatter: (value) => {
              return value === "" ? '\n' : value
            }
          },
          axisLabel: {
            interval: 0, // 强制显示所有标签
            rotate: 45, // 如果需要,可以设置标签旋转角度以避免重叠
            textStyle: {
              fontSize: 10 // 如果需要,可以适当调整字体大小
            }
          }
        },
        yAxis: {
          type: 'value',
          boundaryGap: [0, '100%'],
          splitLine: {
            show: false
          }
        },
        series: [
          {
            name: 'Fake Data',
            type: 'line',
            showSymbol: false,
            data: this.showData
          }
        ]
      };
      if(bool){
        this.timeID = setInterval(()=>{
          this.lastIndex++
          if(this.lastIndex === allIndxe){
            this.lastIndex = 0
          }
          this.showData.shift()
          this.showData.push(this.allData[this.lastIndex])
          if(this.showData[0].showx === this.showData[1].showx){
            this.lastIndex++
            if(this.lastIndex === allIndxe){
              this.lastIndex = 0
            }
            this.showData.shift()
            this.showData.push(this.allData[this.lastIndex])
          }
          myChart.setOption({
            xAxis: {
              // data: this.showData.map(item=>item.showx)
              data: this.showData.reduce((prev, item, index, arr) => {
                const { showx } = item;
                // 排除空字符串,只添加非空的标签
                if (showx !== '') {
                  // 判断当前标签与下一个标签是否相同,相同则不添加
                  if (showx !== arr[index + 1]?.showx) {
                    prev.push(showx);
                  }
                }
                return prev;
              }, []),
            },
            series: [
              {
                data: this.showData
              }
            ]
          })
        },2000)
      }
      option && myChart.setOption(option);
    }
  }
}
</script>
<style lang="scss" scoped>
#demo-main{
  border: 1px solid #333;
  width: 500px;
  height: 300px
}
</style>
以上就是vue使用echarts实现动态数据的示例详解的详细内容,更多关于vue echarts动态数据的资料请关注脚本之家其它相关文章!


最新评论